Analytics Overview
Real-time performance insights across your locations, sublocations, and services
Tiquo's analytics give you a real-time view of how your business is performing across locations, sublocations, and services. Data is collected automatically from bookings, orders, payments, and customer activity, so you can understand performance without manual reporting.
Navigating to Analytics
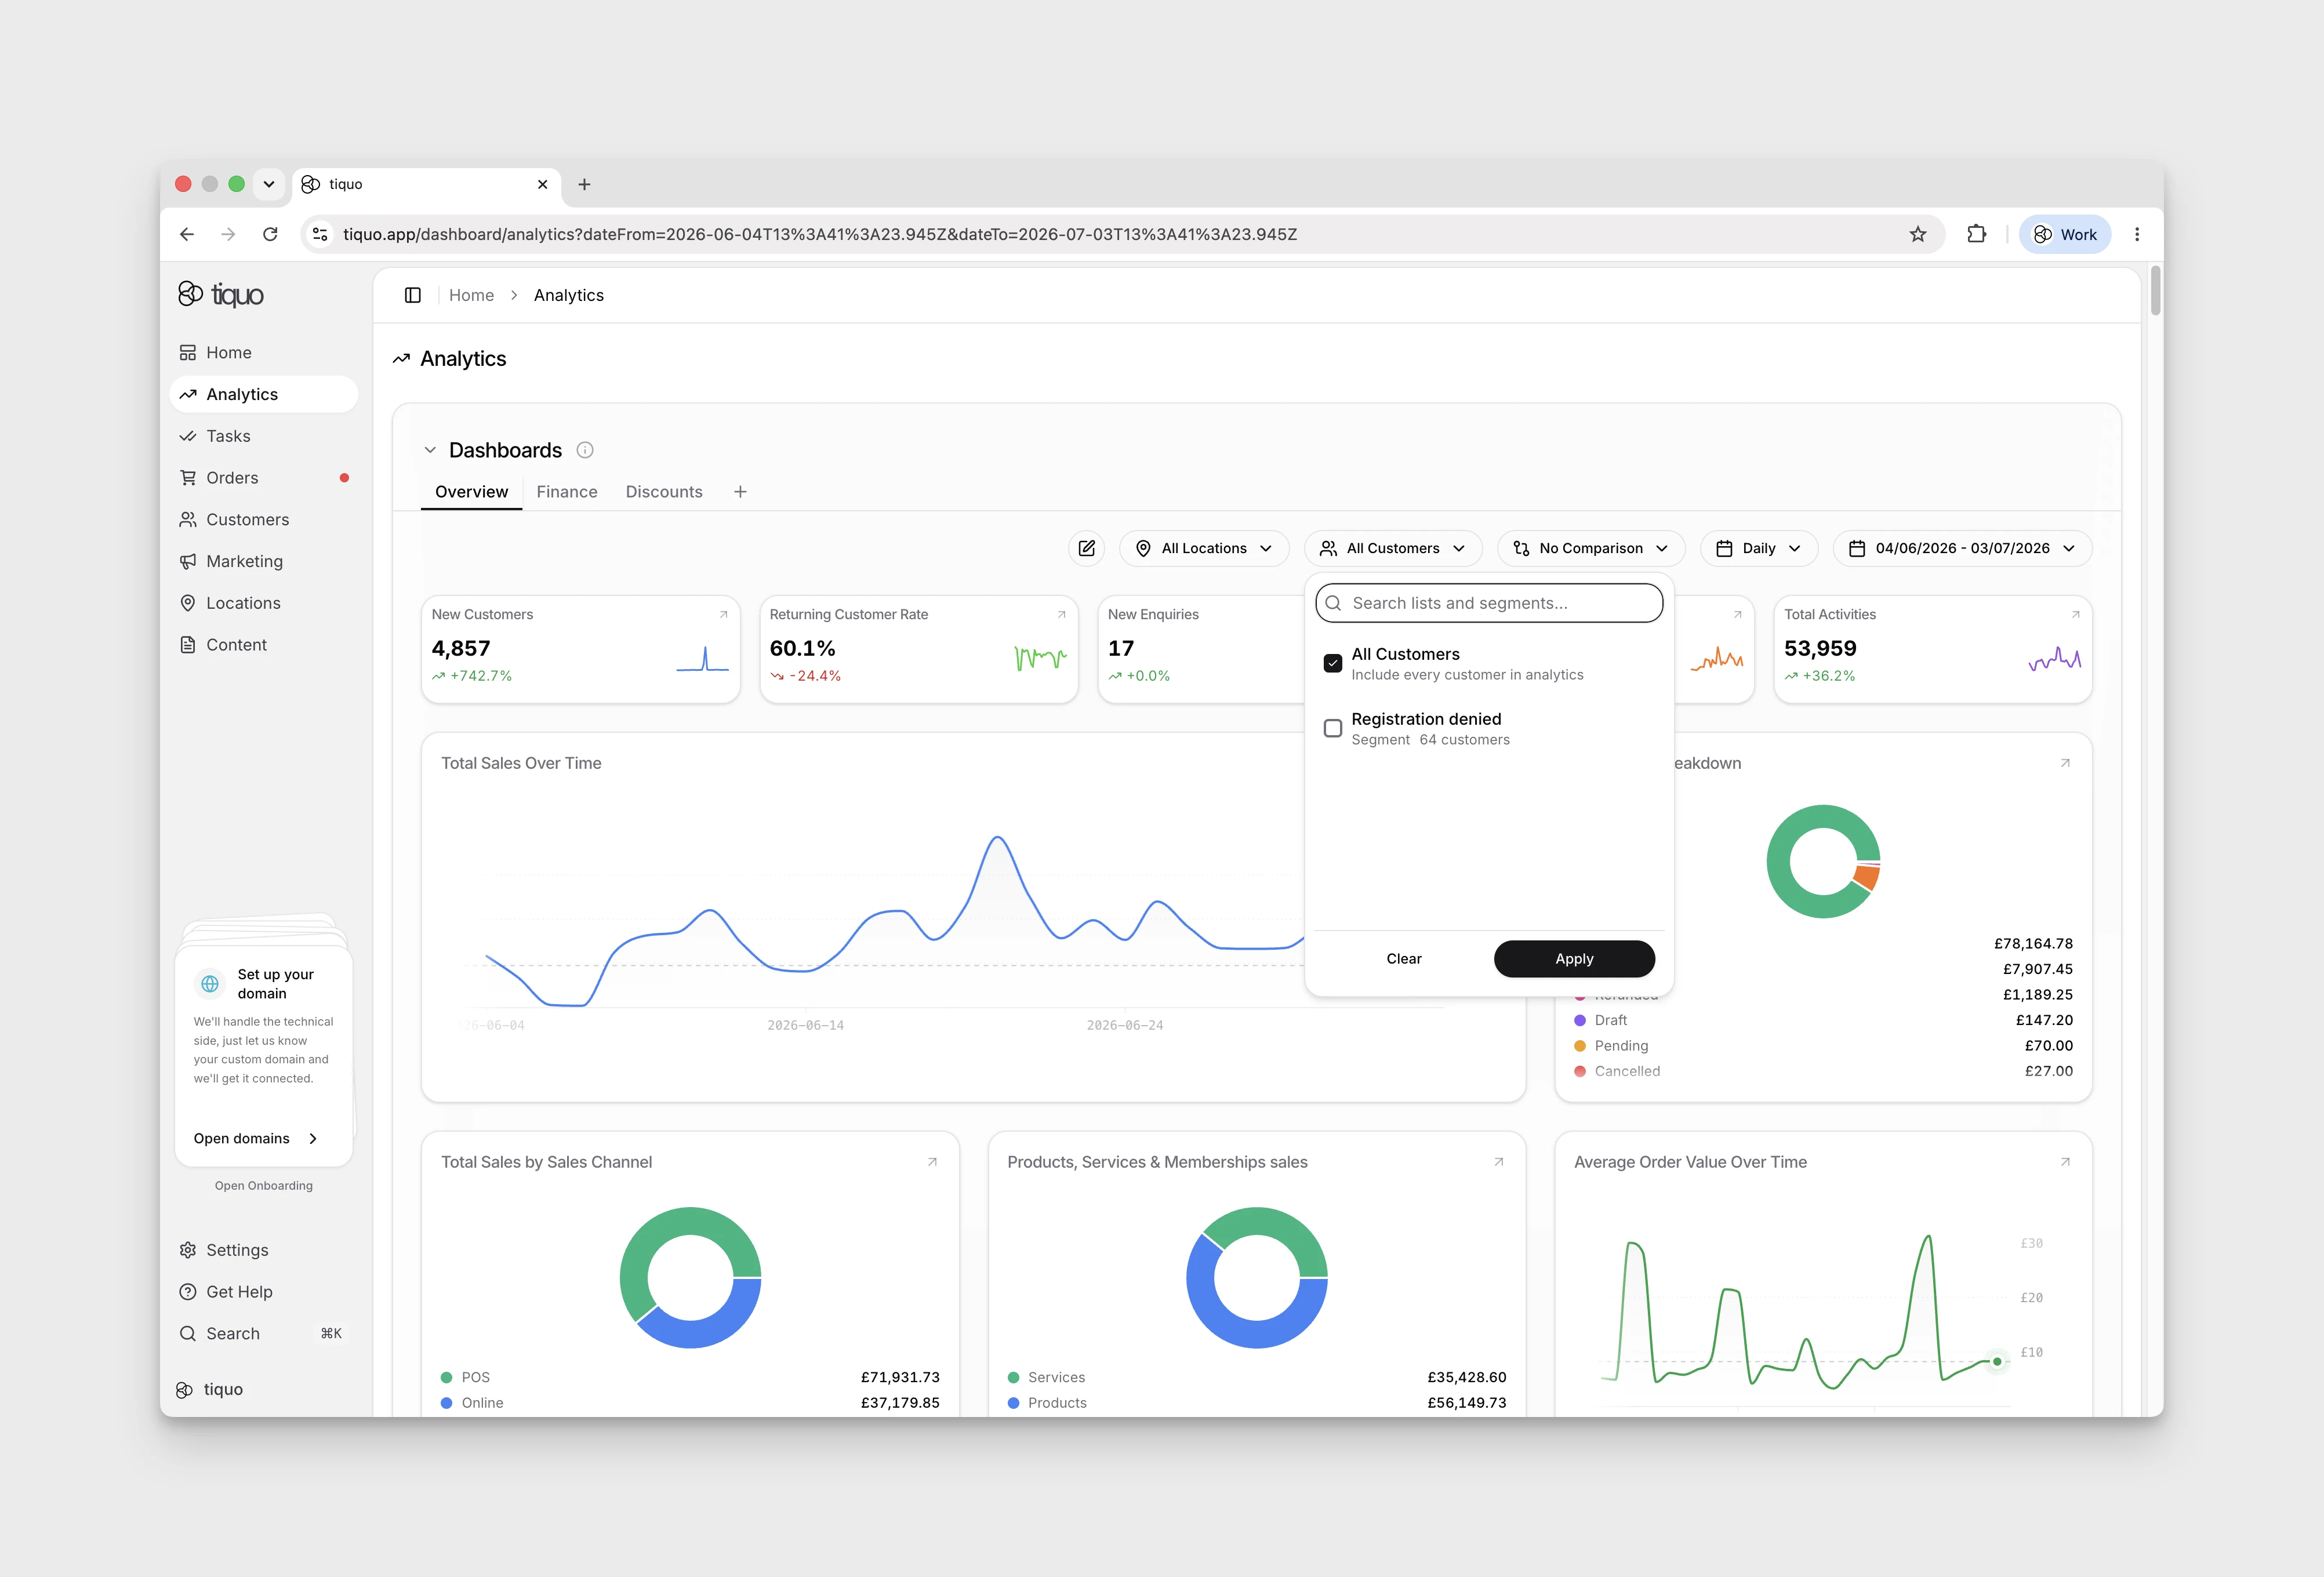
The Analytics entry in the main sidebar opens the Analytics dashboard. The page is a customisable grid of stat cards and chart cards, with header controls above the grid (Edit, location filter, comparison mode, granularity Daily/Weekly/Monthly, date range). Each card opens a larger drill-down view when clicked.

The dashboard supports many chart types: line and area charts for over-time series, donut charts for breakdowns, map and globe views for location-distributed metrics (Sales by Location, Bookings Globe), funnel and Sankey charts for pipelines (Conversion Funnel, Order/Booking/Enquiry flow), hourly views for time-of-day patterns (Avg Bookings by Hour, Avg In-Person Activity by Hour), and pipeline visualisations for status-based metrics. Cards can be reordered, hidden, or replaced via the Edit control.
What the Analytics Dashboard Shows
The Analytics dashboard provides an at-a-glance view of key performance metrics across your organisation.
This includes:
- Sales and revenue performance
- Customer activity and behaviour
- Booking and enquiry trends
- Conversion and marketing performance
- Staff and point-of-sale activity
Metrics can be viewed at organisation, location, or sublocation level, allowing you to quickly move between high-level insight and operational detail.
Each stat card on the dashboard expands into a larger drill-down window with Tiquo AI when clicked, giving deeper context without leaving the page.
Filtering Analytics
Analytics can be filtered by date range, location, and sublocation to focus on specific time periods or parts of your business.
- Date filters allow you to view performance over custom ranges or predefined periods
- Location filters let you isolate individual venues or compare performance across multiple locations
- Customer list filters let you scope customer-backed charts to selected marketing lists
- Comparison views allow you to measure changes over time, helping you spot trends, seasonality, and growth
- Segments let you filter analytics by customer segments. Segments are customer groups defined by any combination of filters set up in the Marketing section. Filtering analytics by a segment lets you see how a specific audience, for example VIP members, first-time visitors, or lapsed customers, is performing against your metrics. See Lists & Segments for the full setup.
These filters update the dashboard instantly, so you can explore data without reloading or exporting reports.
Chart search works across chart names, metric labels, and descriptions. This is useful when a dashboard has many cards and staff want to find a specific chart quickly.
Website Analytics
Website Analytics shows traffic and engagement from sites connected to Tiquo.
It includes first-party pageviews, sessions, traffic sources, devices, known-customer activity, and custom events sent through the DOM Package or Tiquo-managed content sites.
For the full website analytics workflow, see Website Analytics.
Funnel and AI Analysis
Funnel charts show where customers continue or drop off during a journey.
When a funnel card is opened, the drill-down view can include conversion and drop-off statistics for each step, alongside Tiquo AI analysis where enabled. This helps teams understand which step is creating friction before changing a flow or campaign.
Recent Activity Summary
The Recent Activity section highlights the latest activity across the platform.
This includes recent bookings, orders, payments, and customer actions as they happen. It provides a live operational snapshot, helping teams quickly understand what is happening right now without navigating into individual records.
Recent Activity block
The bottom of the Analytics dashboard includes a Recent Activity table: chronological rows of recent events with Time, Type, and Activity columns (e.g., orders placed, payments processed, customer registrations). A View all button on the block opens the full Activity Logs feed. Useful as a quick operational read.
Payments block
Below Recent Activity sits a Payments block. It surfaces Stripe-fed payment activity scoped to a selected location, with quick-select chips for any Stripe-connected location. The block is location-scoped: a location must be picked before payment data appears.
For the org-wide Payments dashboard with embedded Stripe Connect tabs (no sublocation context), see Payments.