

Performance Insights
Understand what drives revenue, demand, and operational performance
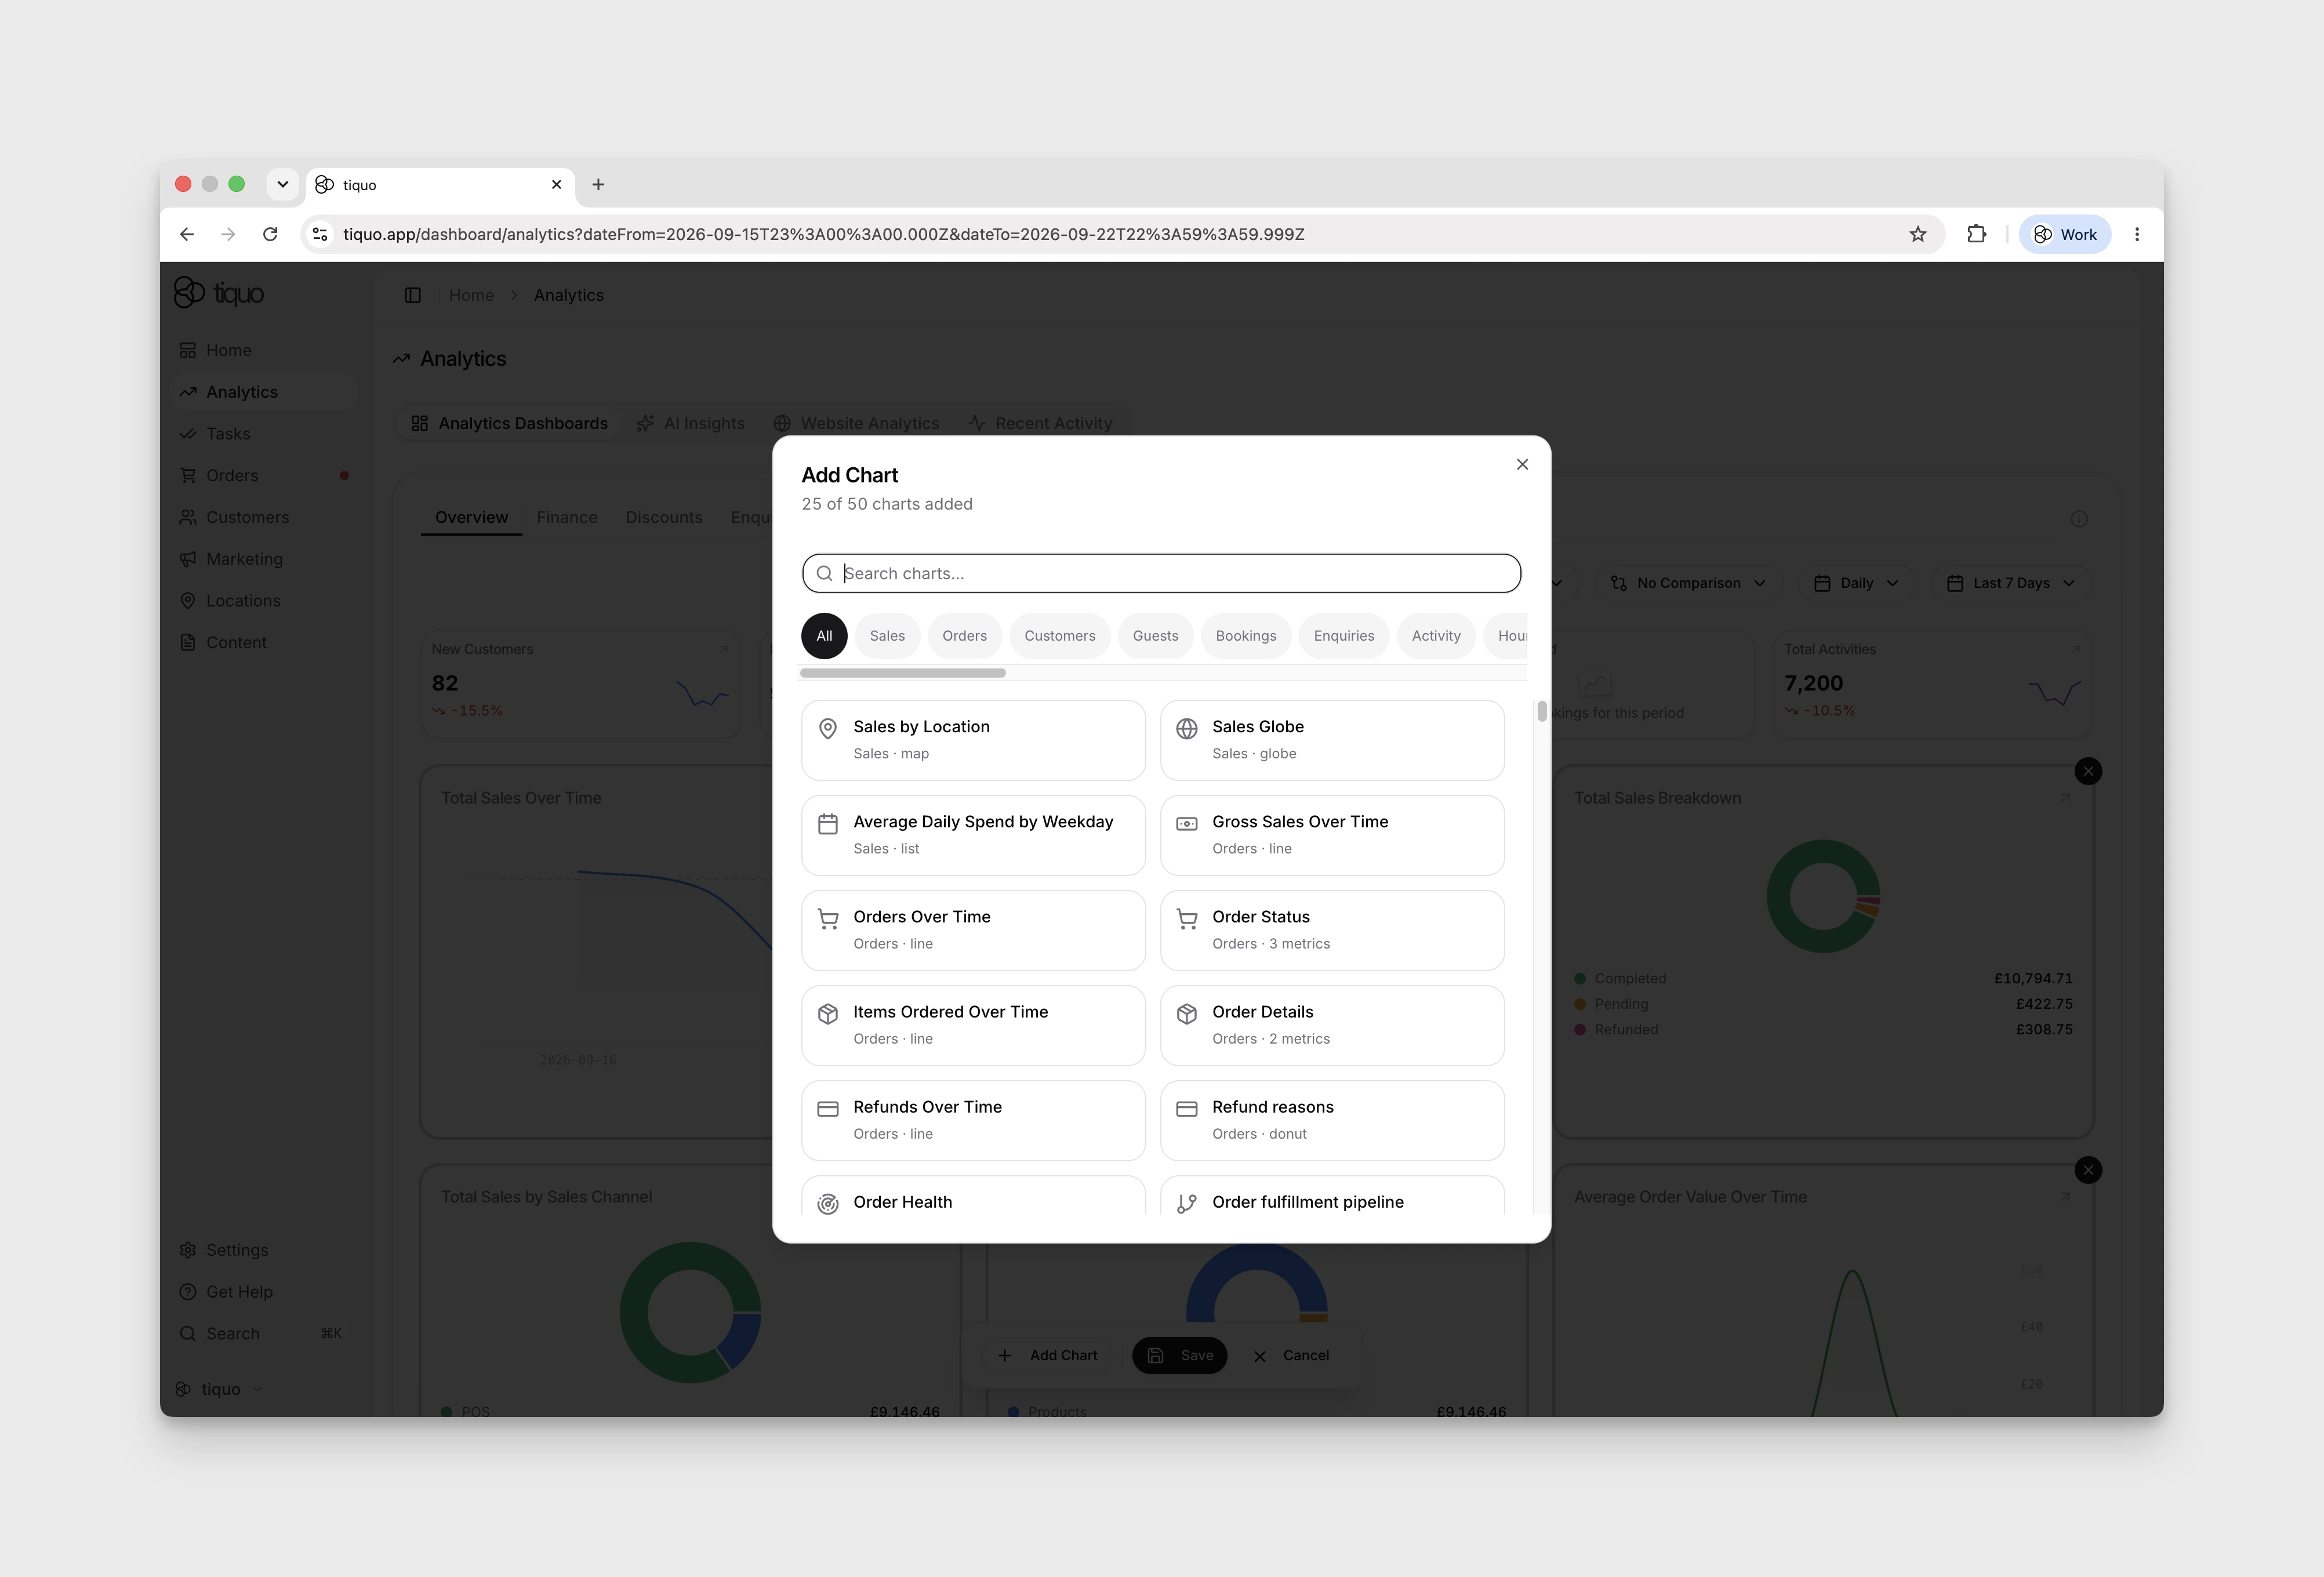
Performance insights are available through Analytics → Analytics Dashboards. Open Overview → Edit → Add Chart to browse charts by business area or search for a chart name. Categories include Sales, Activity, Discounts, Lost Carts, Memberships, and Capacity.
Sales and revenue performance
Review total sales, trends over time, and revenue by location, sublocation, product, or service to see which areas are performing well and which need attention.
Sales data is updated in real time and reflects both online and in-person transactions.
Customer and booking activity
Track new and returning customers, booking volumes, check-ins, and customer activity. Compare them over time or across locations to understand demand, loyalty, and engagement.
Conversion and funnel performance
Follow sessions, conversions, and drop-off points through booking, payment, and check-in flows. Look for steps where customers leave to find opportunities to improve completion rates.
Marketing and referrer performance
Compare traffic and revenue by referrer, including direct, referral, and campaign activity, to see which channels lead to engagement and sales.
POS and staff performance
Review point-of-sale usage, recorded activity by staff member, and operational throughput. The staff activity ranking counts qualifying activity-log events and distinct activity categories; it is not a staff revenue or sales-value calculation.
Enquiry staff charts use enquiry assignments to show workload and outcomes. An enquiry with multiple assignees contributes once to each assignee, while unassigned work remains visible separately. Conversion means the enquiry is currently won or has at least one linked order; the charts show attribution, not proof that an individual staff member caused the outcome.
Discounts, lost carts, memberships, and hourly patterns
The dashboard also includes:
- Discounts: total discounts given, discount rate, discounted vs full-price orders, top customers by discount value or frequency, most-discounted products and categories, discounts by sales channel, discount code performance.
- Lost carts: cart abandonment rate, lost cart orders and revenue over time, top products in lost carts, lost carts by channel.
- Memberships: active members, monthly recurring revenue, new and cancelled members, retention, churn, average tenure, upcoming renewals, plan and billing-period mix, cancellation reasons, plan changes, and minimum-term outcomes.
- Capacity: booked, remaining, full, partial, empty, and overbooked finite capacity, with utilization over time and breakdowns by location, service, category, and inventory.
- Hourly patterns: average product sales, bookings, online activity, and in-person activity by hour of day, useful for staffing and capacity planning.