

Where do I find analytics?
Find the analytics dashboard and open detailed reports.
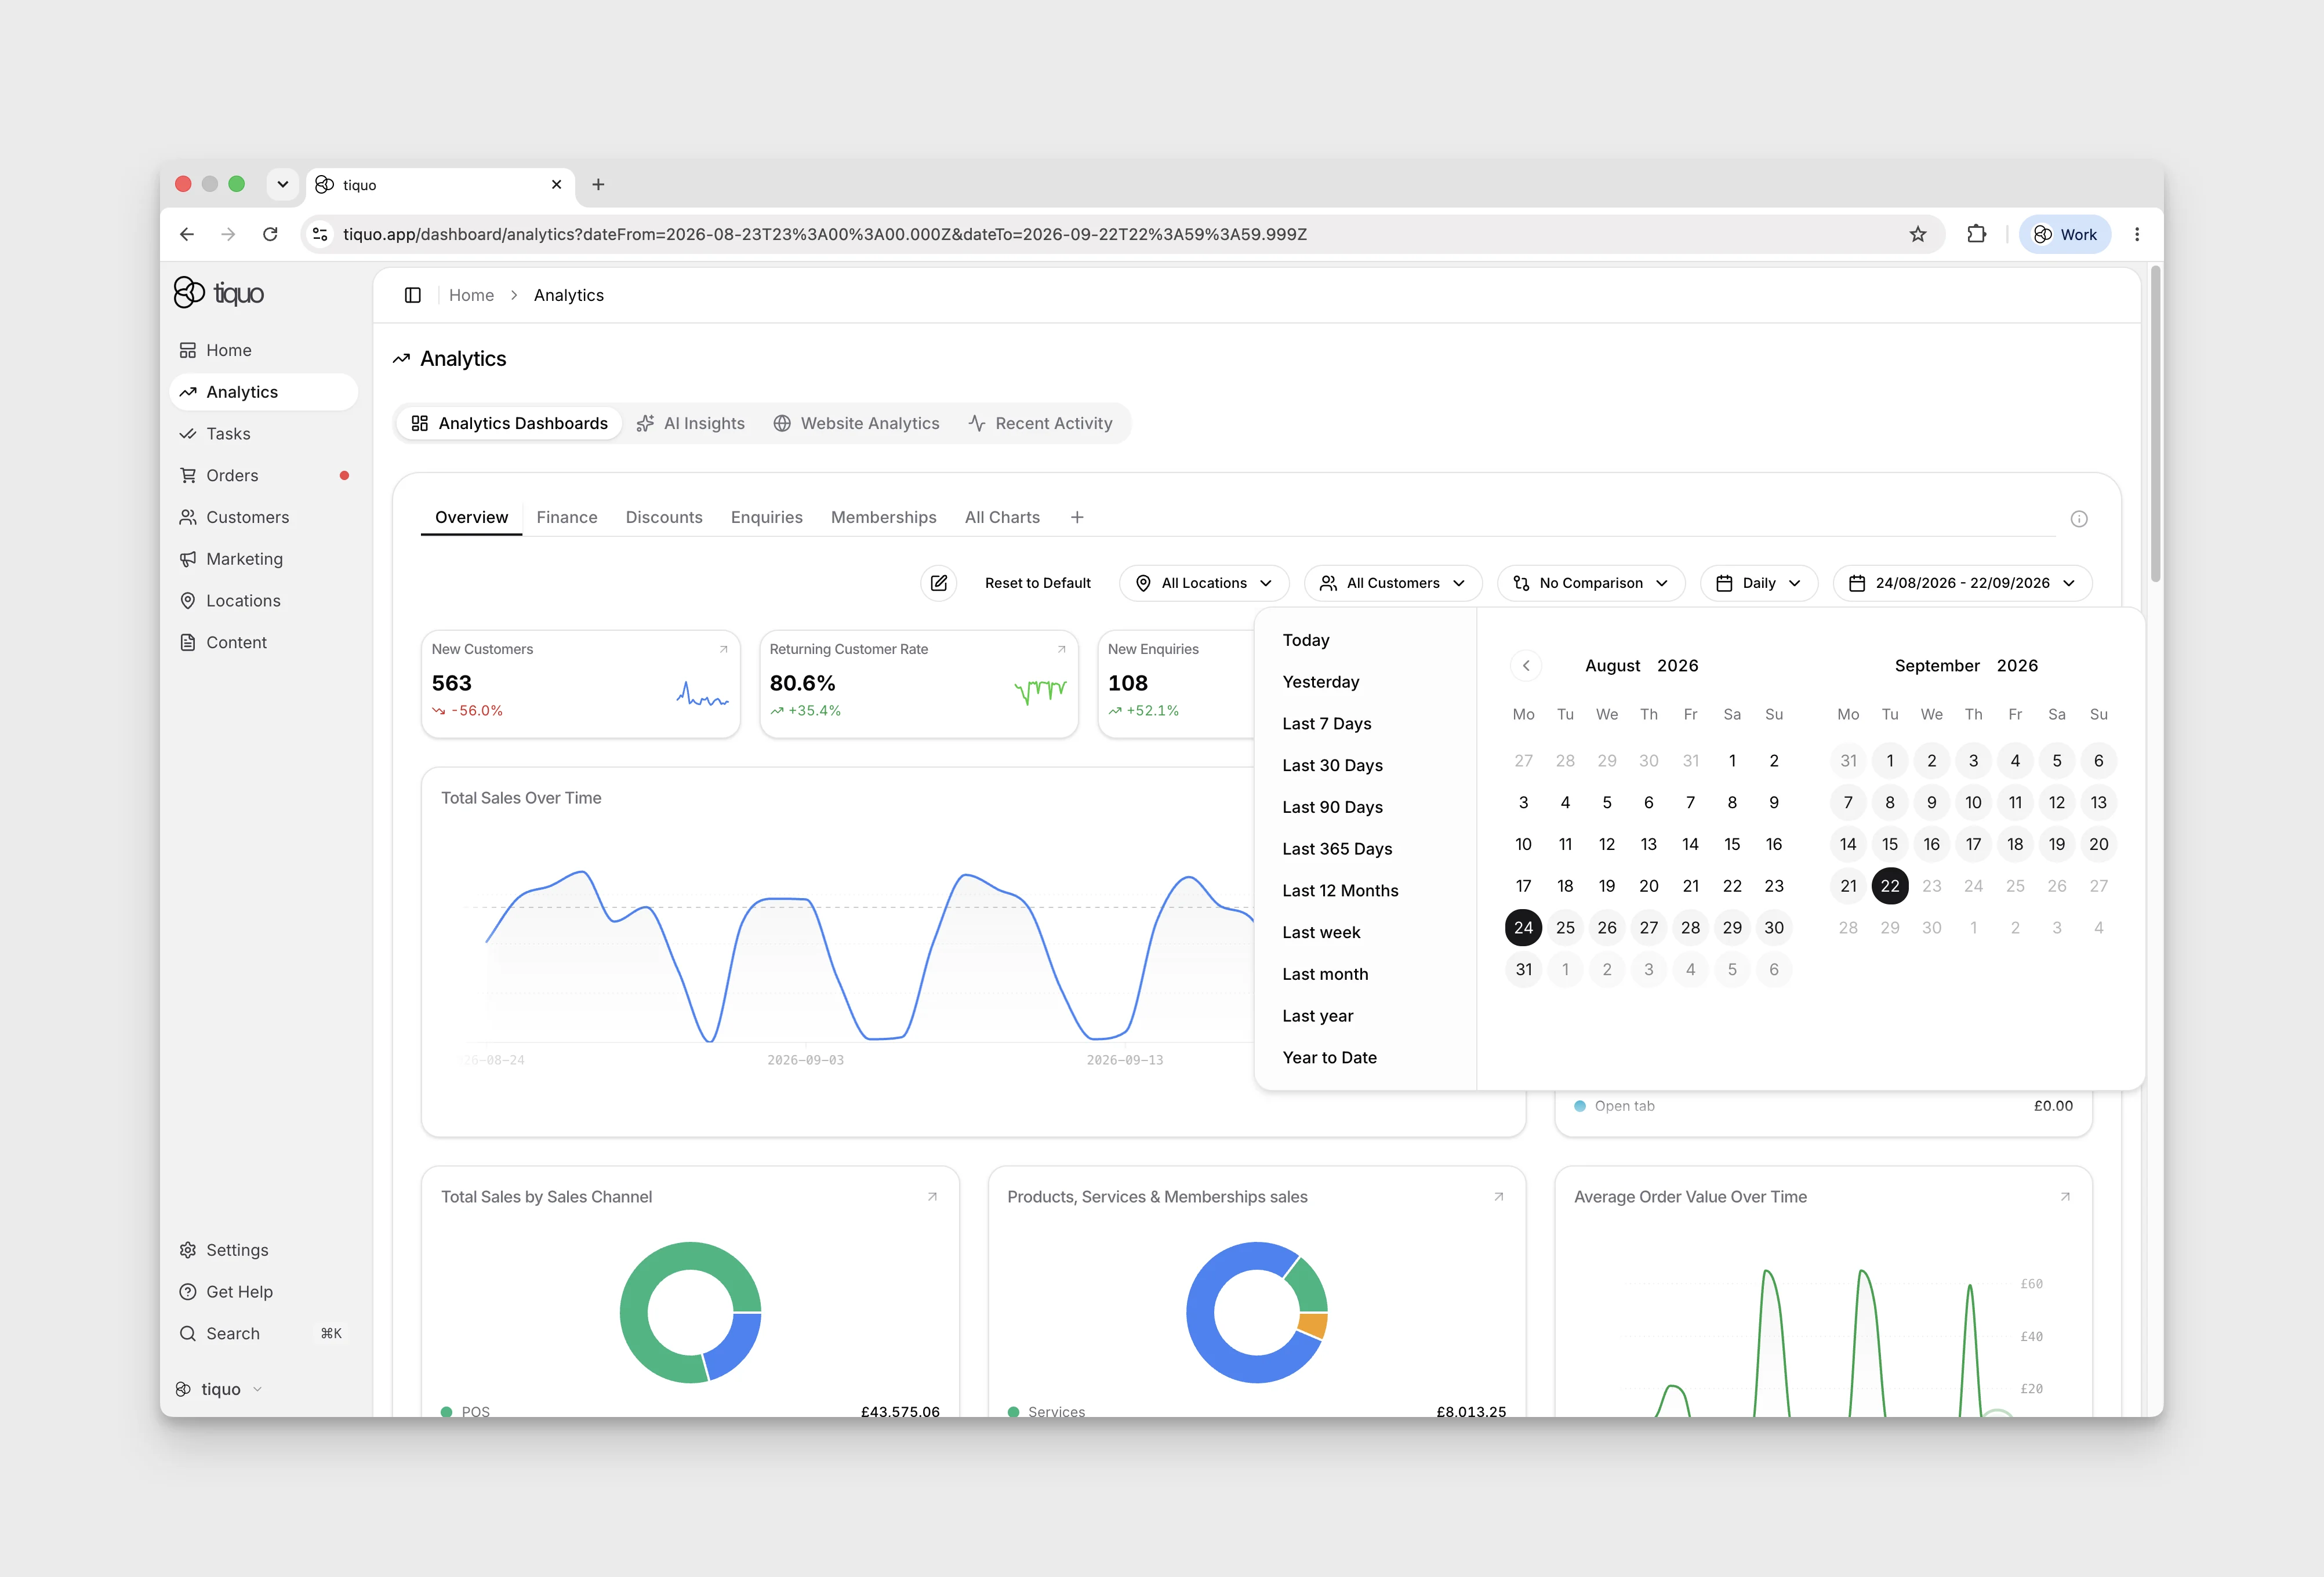
Open Analytics in the main sidebar and select Analytics Dashboards to view the grid of stat and chart cards. Use the controls above the grid to edit it, filter by location or date, and compare periods. Granularity depends on the selected date range: Last 30 Days offers Daily and Weekly, with Monthly disabled. Click a card to open a larger drill-down view.
| Chart | Use it for |
|---|---|
| Line and area | Trends over time |
| Donut | Breakdowns |
| Map and globe | Metrics by location: Sales by Location, Bookings Happening by Location |
| Funnel and Sankey | Pipelines and status-based metrics: Conversion Funnel, Order/Booking/Enquiry flow |
| Hourly views | Time-of-day patterns: Avg Bookings Made by Hour, Avg Booking Time by Hour, Avg In-Person Activity by Hour |
Use Edit to reorder, hide, or replace cards. After reordering, select Save to keep the new layout, or Cancel to discard the unsaved reorder.